What Is A/B Testing?
A/B testing is a UX research technique that can be used to compare two versions of a design and determine which one performs better. The users are presented with either Version A or Version B, and their behavior is tracked to see which version results in better outcomes, such as higher click-through rates, better completion of tasks, or greater user satisfaction.
This technique can be used to compare the results of changes in layout, buttons, text, colors, navigation, and other design elements on a user interface. By using actual user behavior instead of hypotheses, A/B testing enables designers to make informed decisions.
Why A/B Testing Is Important
A/B testing provides value by demonstrating how even small changes to the layout of the product can create dramatic changes in the manner users interact with the product. By testing, rather than guessing, designers can select the design that produces the most positive results to produce superior product usability. Consequently, A/B testing mitigates risk, increases product usability, and ensures that design decisions are databased through empirical evidence.
How to Conduct an A/B Test
- Identify a target.
Choose a target you want to change, e.g., you want to increase leads through your landing page or lower bounce rates from AdWords.- Version A: the original design
- Version B: a modified version with one clear change
- Create two prototypes.
Version A: the old prototype.
Version B: the new prototype; Version B will have just one key difference (a change). - Select a measurement.
Choose a measurable result you want to use to measure success (e.g., percentage clicks, time on page, percentage for completed leads). - Split users at random.
Use randomization to show each set of users either Prototype A or Prototype B. This will help you create an unbiased test, however; both sets of users must have the same strength of intent to make the purchase. - Run the test.
Let it run long enough to gather enough data to give statistically significant measurements. - Evaluate results.
Use performance measurements to evaluate which version is the best version to achieve your desired result. - Implement the best version.
Implement the version of the prototype which performs best and keep records of the results.
Tools Used for A/B Testing
Google Optimize: A tool for designers to experiment with multiple versions of a web page in order to determine which one performs best
Optimizely: A widely-used experimental platform that focuses on A/B testing and personalized experiences.
VWO (Visual Website Optimizer): Offers tools for conducting tests, as well as heat map analysis and analytics.
All of these tools are designed to enable users to manage visitor traffic to their sites, gather data for reporting purposes and create reports.
Visuals and Illustrations
Generally, visual aids are used for explaining A/B testing:
- Screenshots showing the differences between an A and a B version
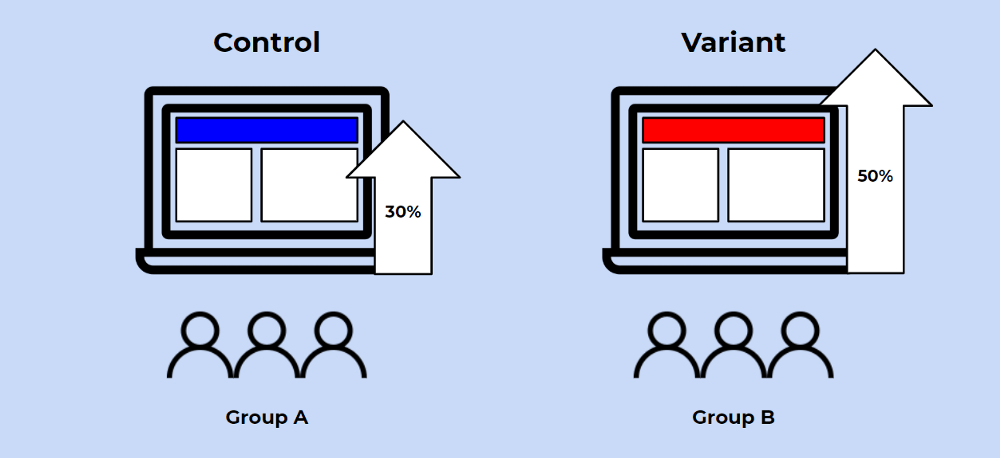
- Diagrams illustrating the division of users into two groups
- Charts that show how well both versions performed in terms of their respective results
Research Studies Using A/B Testing
Experiment 1: Testing Different Button Colors
A Google study looked at the effects that 2 colors and 3 different words on the buttons used for call to action are having on user engagement and click-through rates. They found that minor changes to the labels and their colors on buttons have a large effect on these metrics and demonstrate the importance of continuing doing iterative testing.
Experiment 2: Testing Headlines on News Websites
The BBC studied the effects of different wording of headlines through A/B testing in order to evaluate which format is best to drive users to click. Their research indicated that using emotion had greater incentive to promote clicking; however it also had a negative effect when it comes to understanding what the articles are about. They stressed the importance of balancing engagement and understanding in headline development.
Experiment 3: A/B Testing of the E-Commerce Checkout Process
The Nielsen Norman Group published a report on how A/B testing was used to help minimize abandonment rates during the checkout process of e-commerce sites. The data showed that through the use of A/B testing on both forms and buttons in the checkout process, the changes made to improve these objects had a direct effect on completion rates and improved the user’s experience.
